Office work has changed since the pandemic. Employees are exercising their choice to work fluidly between different workspaces inside and outside the office in search of environments that support specific types of work they are conducting. The workplace is facing significant competition to be a work destination of choice to employees — and currently, it’s not delivering what employees need.
Gensler’s latest Global Workplace Survey Comparison report reveals that there are remarkable commonalities across the world between how employees are working in 2023 and how the workplace is responding to change. Successful workplace performance is rooted in office space effectiveness and workplace experience — the presence of both results in workplaces that drive better outcomes for individuals, teams, and businesses. Currently, just 43% of surveyed workplaces offer effective spaces and great workplace experiences; one-third have neither. This global workplace study exposes the gaps in workplace performance and offers opportunities for the workplace to meet the moment.
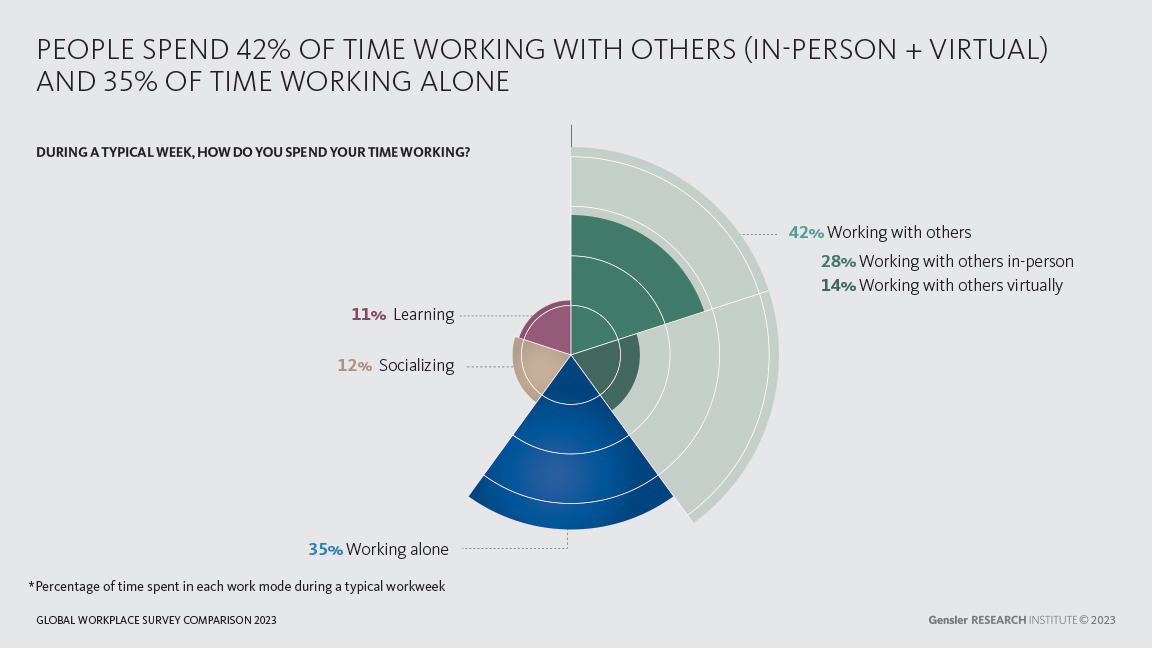
Office workers spend most of their time working with others.
We have found remarkable similarities in the way employees across the world are working. Office workers in all nine countries surveyed spend an average of 42% of their time working with others, consisting of virtual (14%) and in-person (28%) work. They spend the second largest amount of time working alone — this percentage varies across countries, reaching a high of 41% in Canada and a low of 28% in Saudi Arabia and the Philippines.
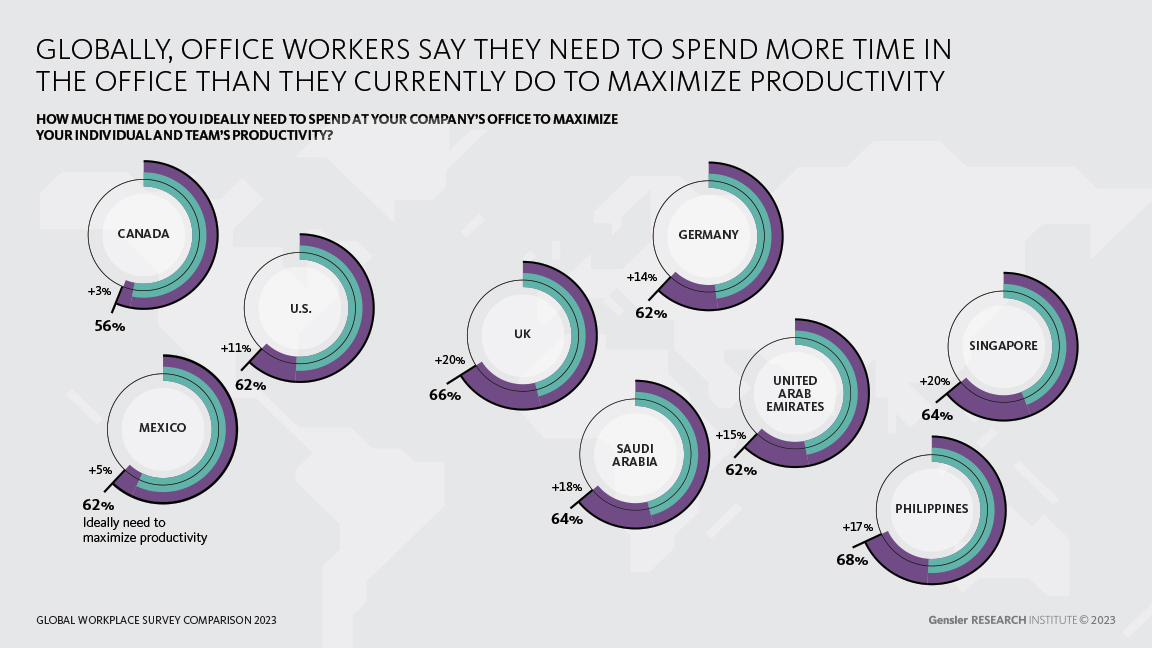
There is a gap between current office utilization and what employees say they need for productivity.
To maximize productivity, office workers say they need to come into the office more often than they currently do. The gap between current office utilization and perceived time needed in the office for productivity is greatest for workers in the UK, Singapore, and Saudi Arabia. This chasm varies between employees based on how they spend their time working. For the majority of employees, the sweet-spot of office utilization is between 58% and 68%.
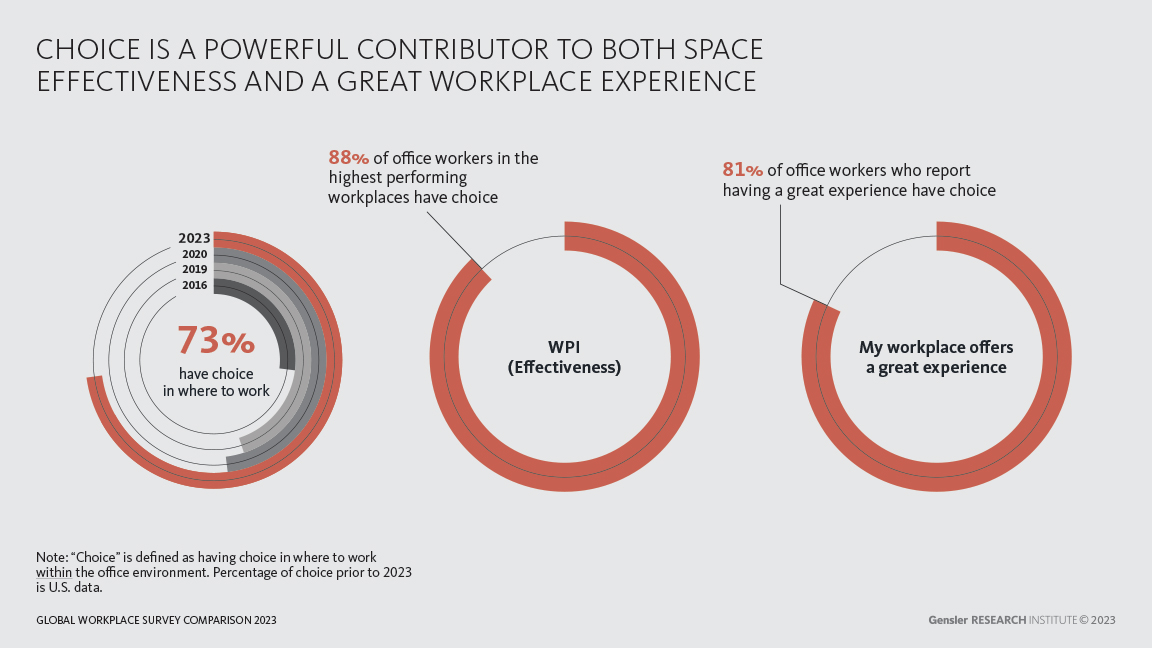
The workplace must offer choice to become a destination of choice.
It is not enough for the workplace to simply be effective; it has to also offer a great experience. Choice in where to work within the office is a fundamental component of workplace experience in 2023. Almost three-quarters of office workers have choice in where to work in the office and 81% of those who have a great workplace experience also have choice. A mix of workspaces consisting of creative group work, individual work, spaces to reflect and restore, and to connect and recharge are vital components of a balanced workplace.
Effective spaces and a great workplace experience have far-reaching benefits for the business, team, and individual.
Our global study highlights the powerful interplay between effective spaces and workplace experience. Employees in workplaces that leverage both these components are more engaged, more committed to their organization, more aware of workflows, and have better team relationships and a stronger sense of belonging. These workplaces have significant impacts on the business at all levels from personal productivity and well-being to better decision-making and quality of work.
Global Workplace Survey Comparison 2023 Methodology
The Gensler Research Institute deployed an online survey to an anonymous panel of 14,000 office workers across two waves in a repeated cross-sectional study. In the first wave, fielded between June 14 and September 11, 2022, respondents were required to be located in the U.S., Mexico, or Canada. In the second wave, collected between November 3 and December 26, 2022, respondents were required to be located in Germany, the UK, UAE, Saudi Arabia, Singapore, or the Philippines. The survey was deployed using a third-party panel provider. Survey respondents were required to be employed full-time, to work from an office environment at least some of the time, and to work for a company, organization, or firm of at least 100 employees at the time of data collection, excluding fully remote workers and those working in companies of less than 100 employees.
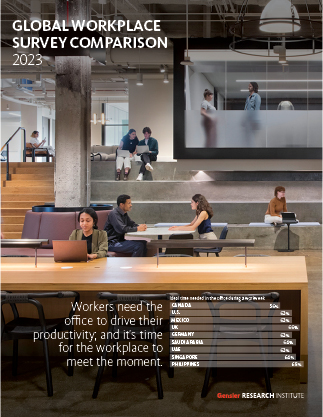
Download the full Global Workplace Survey Comparison 2023 to explore how the workplace can respond to the global and regional patterns of work. Our data provides key insights into where design interventions can be made to improve the overall effectiveness and experience of the modern office.